Android Studio has a powerful profiler to find performance bottlenecks in your app. Most likely, you want to optimize the app startup time. This is a little step-by-step guide to start the profiler at app startup and record all the stacktraces to find out which method calls take the longest. For more details, please review the official profiler documentation.
For these instructions, I used “Android Studio Hedgehog, 2023.1.1 Canary 16”, with my “Save To…"-App.
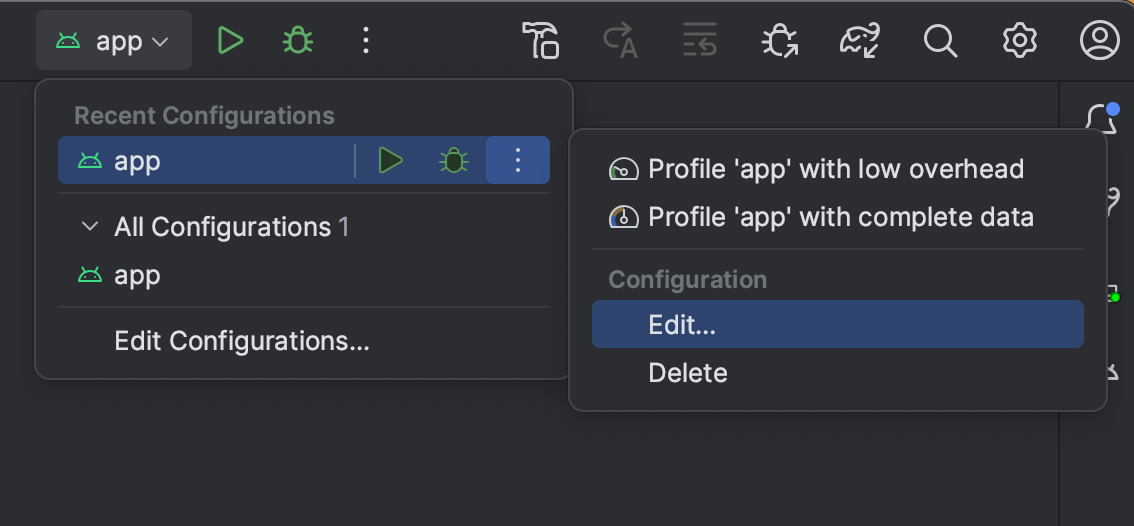
1 Edit the app's Run Configuration
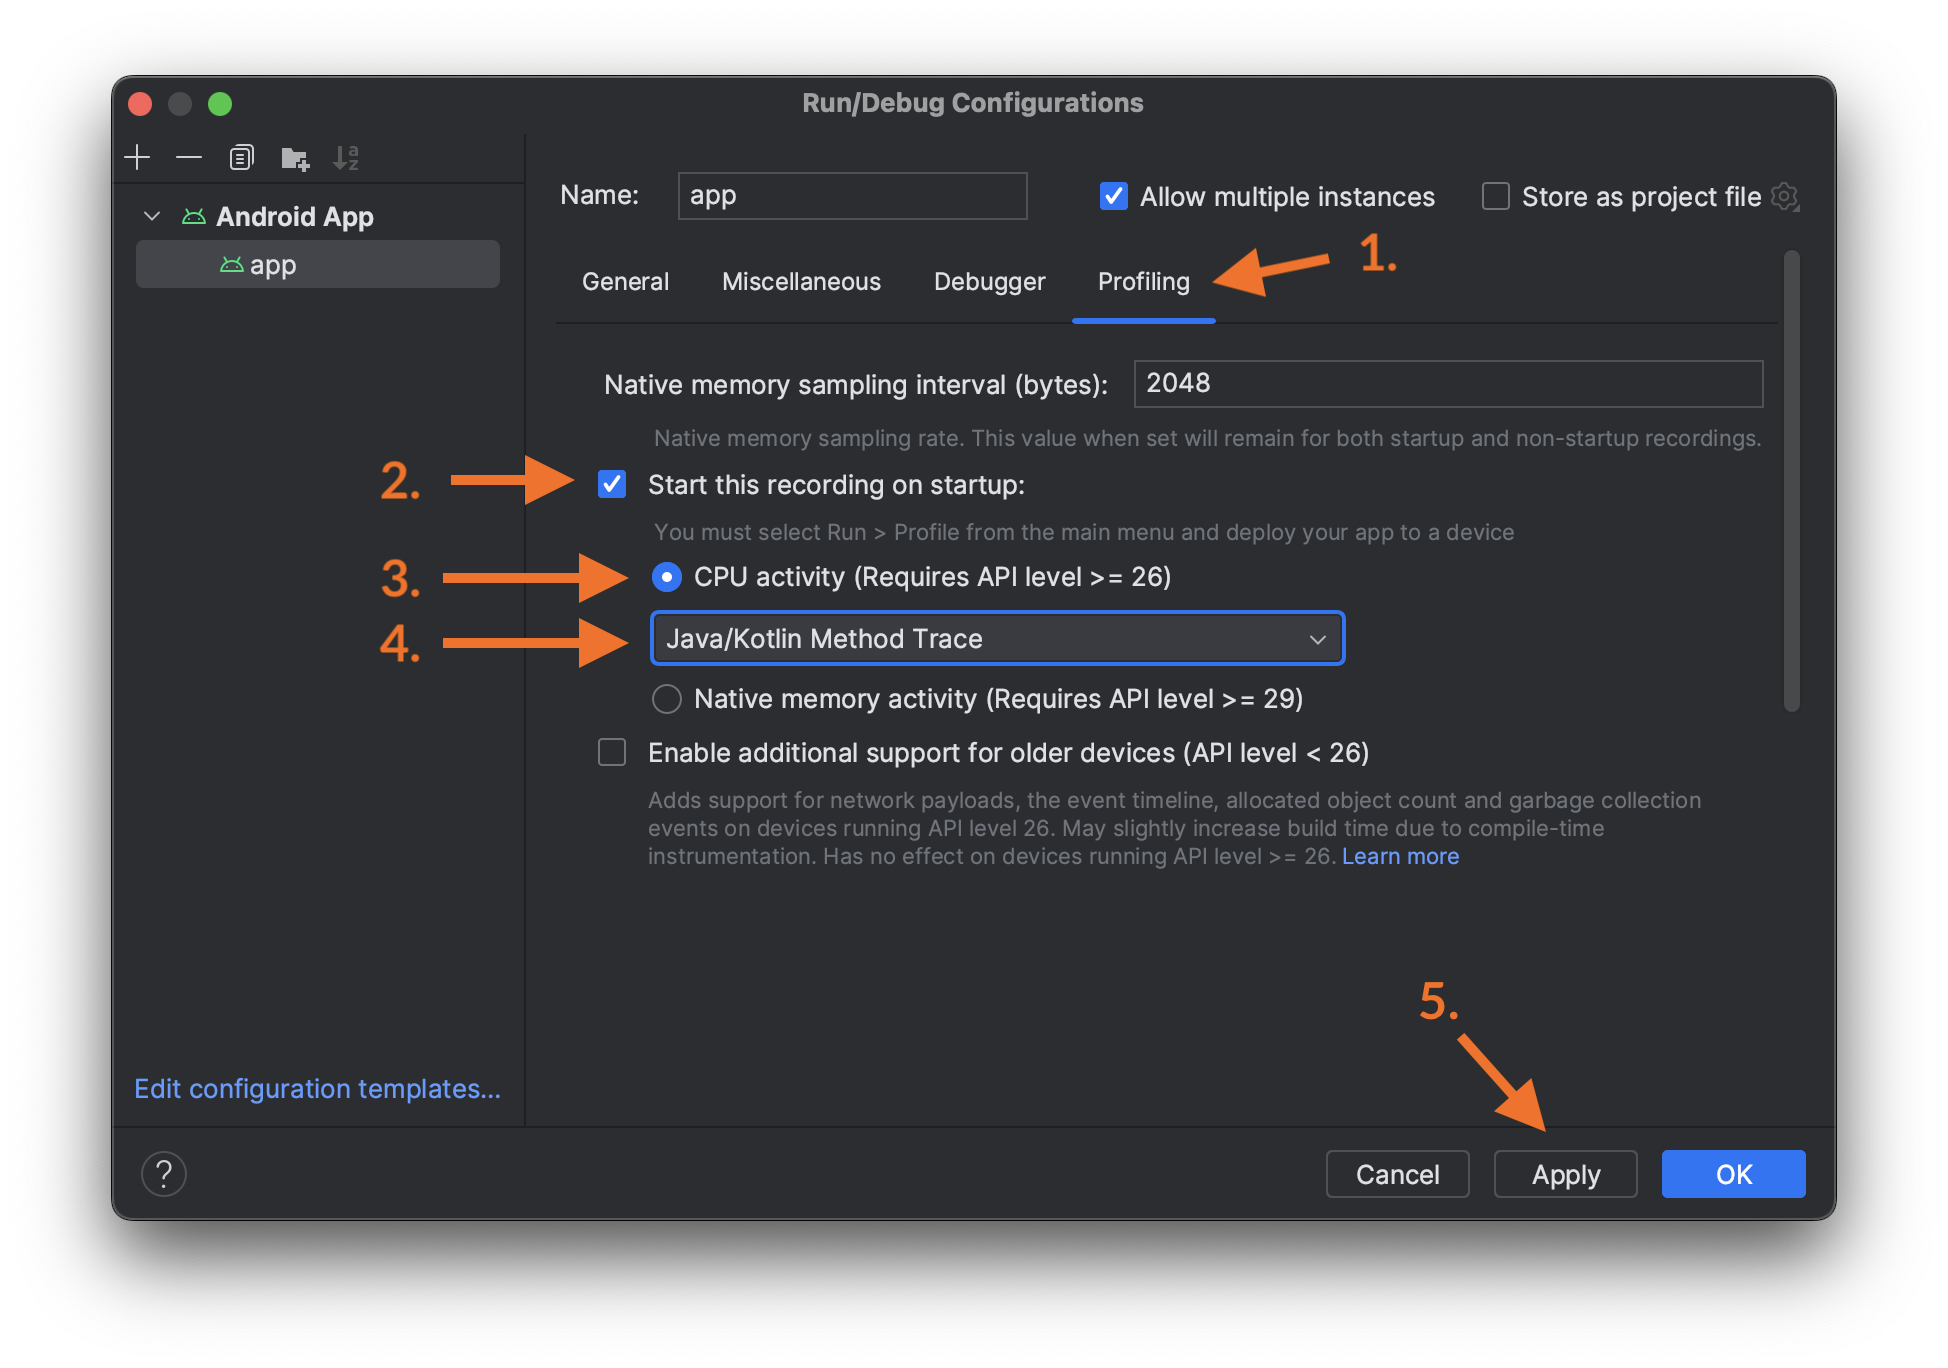
2 Enable CPU Activity Profiling
- First, select the “Profiling” tab.
- Enable “Start this recording on startup”.
- Select “CPU activity”.
- Choose “Java/Kotlin Method Trace”: This option will record every single method call! This has a huge overhead and might impact runtime performance, especially for many short method calls. The profiler might exeed its file size limit and stops recording. An alternative is the option “Java/Kotlin Method Sample”: It doesn’t record every single method call but only frequently samples the call stack. This should be enough to get an overview, but short method calls might not be visible in the result. More details in the official documentation.
- Then press on “Apply”.
Important: Do not run the app directly from the Configuration dialog! This won’t start the profiling!
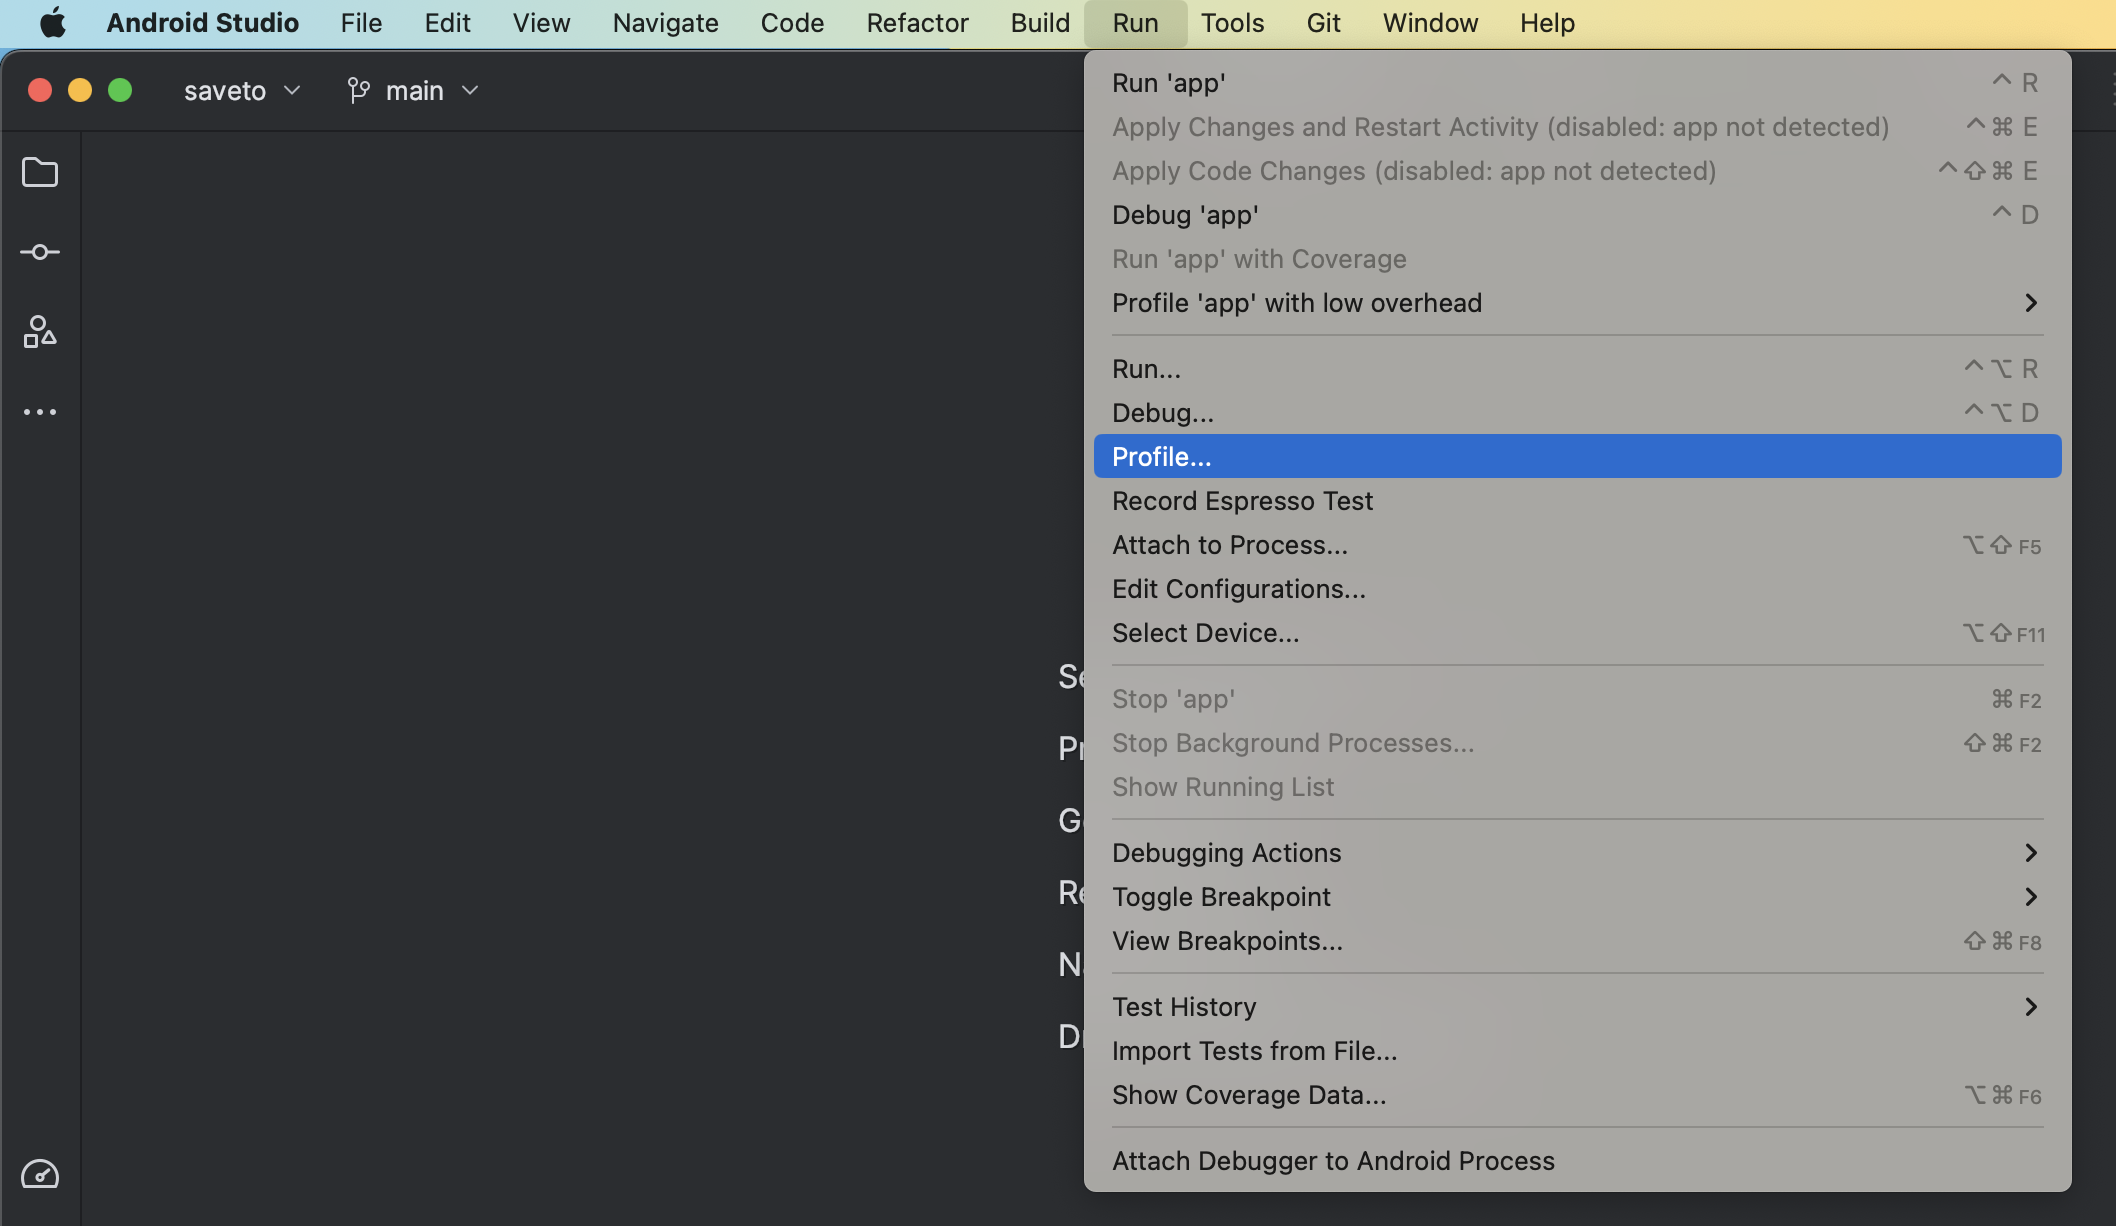
3 Profile from the Menu
In the menu, select “Run ▸ Profile…”
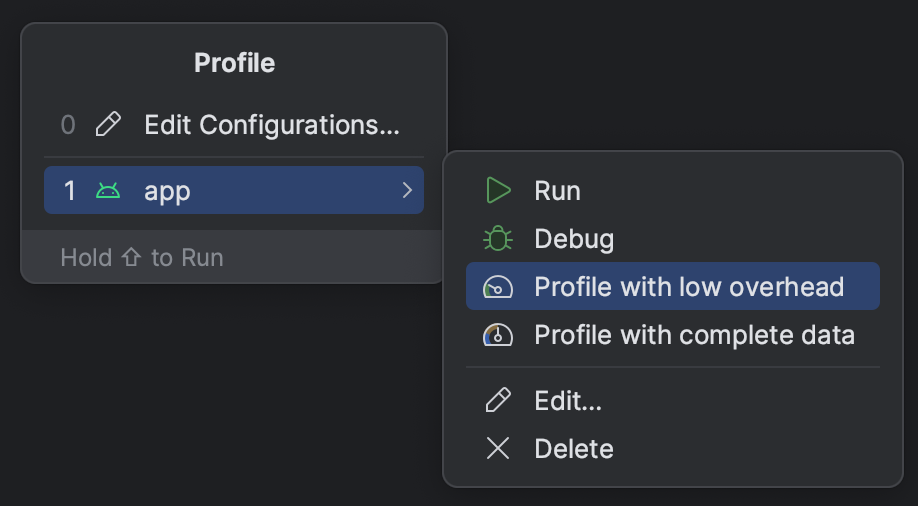
4 Profile from the Menu
In the small window that opens up, select your “app” configuration, then “Profile with low overhead”. (You can also select “Profile with complete data”, but “Profile with low overhead” is enough for our purposes).
5 Profile App Start
The app is now started and you should see the Profiler tool window. If you don’t, you can open it via “View ▸ Tool Windows ▸ Profiler”.
Wait until your app is started (look at your phone or emulator), then stop the profiling of the app by clicking on “Stop the current profiling session”.
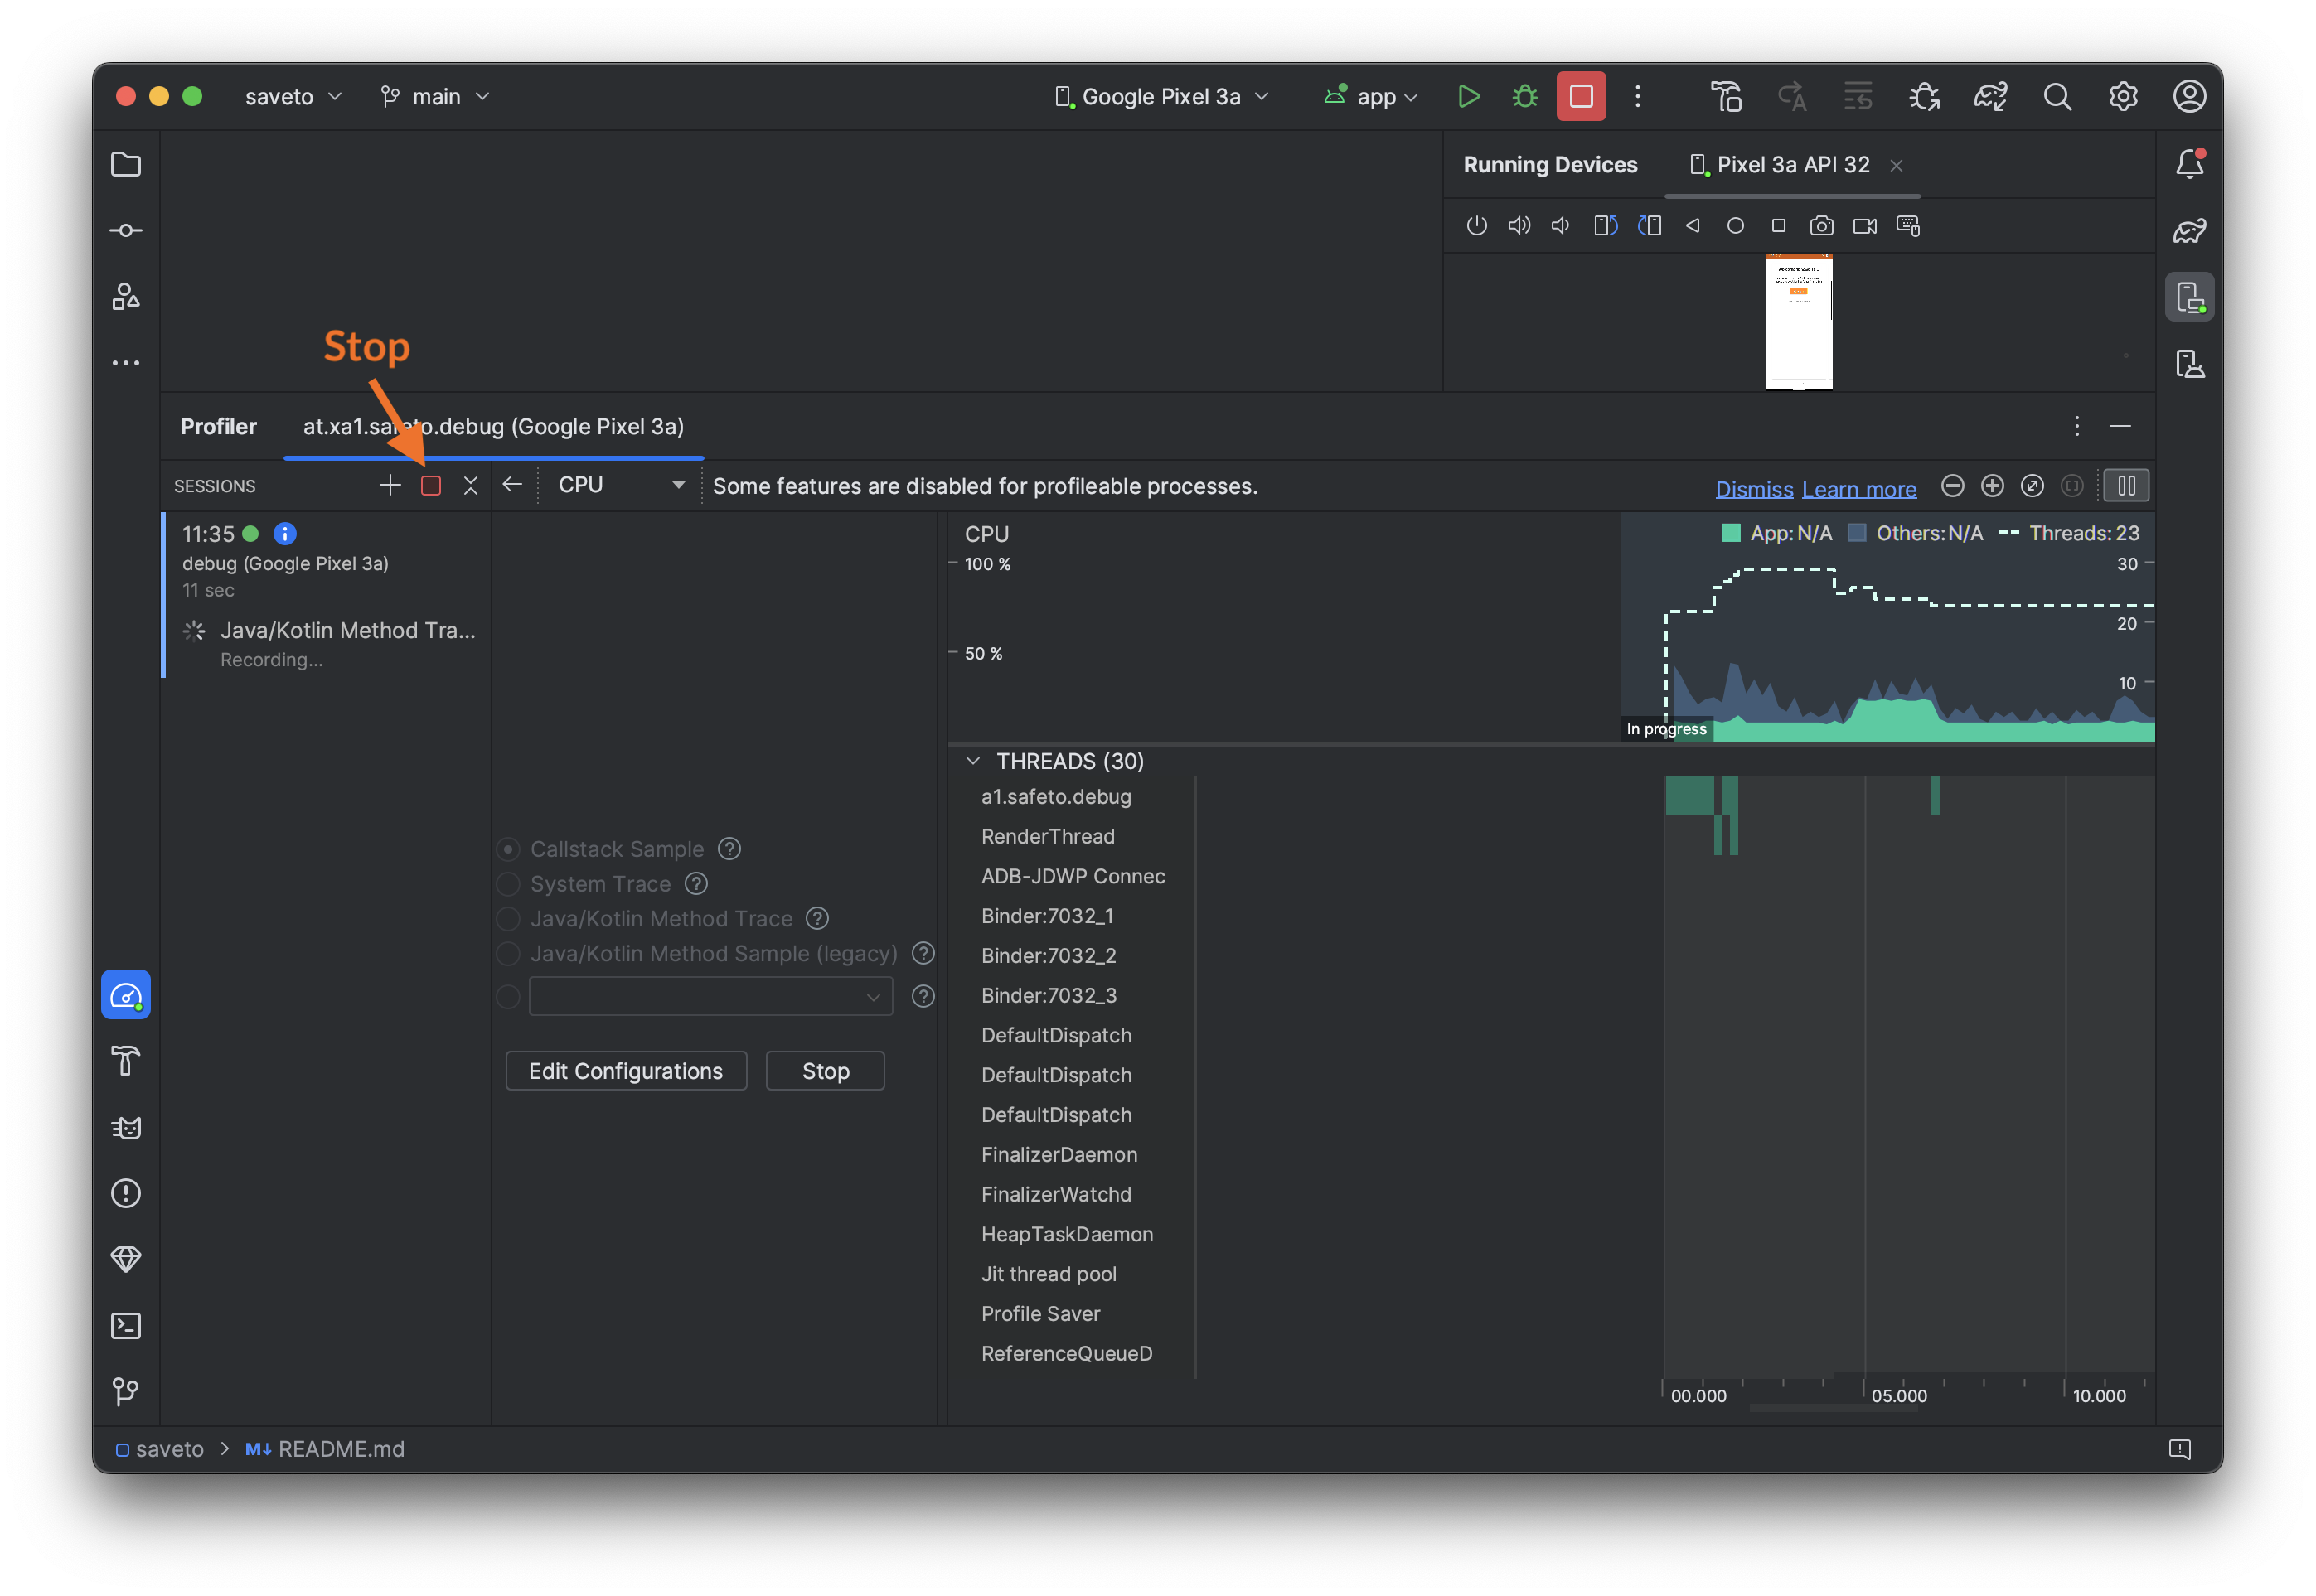
After stopping, the Profiler needs to parse the collected data. This might take some time (several seconds up to minutes).
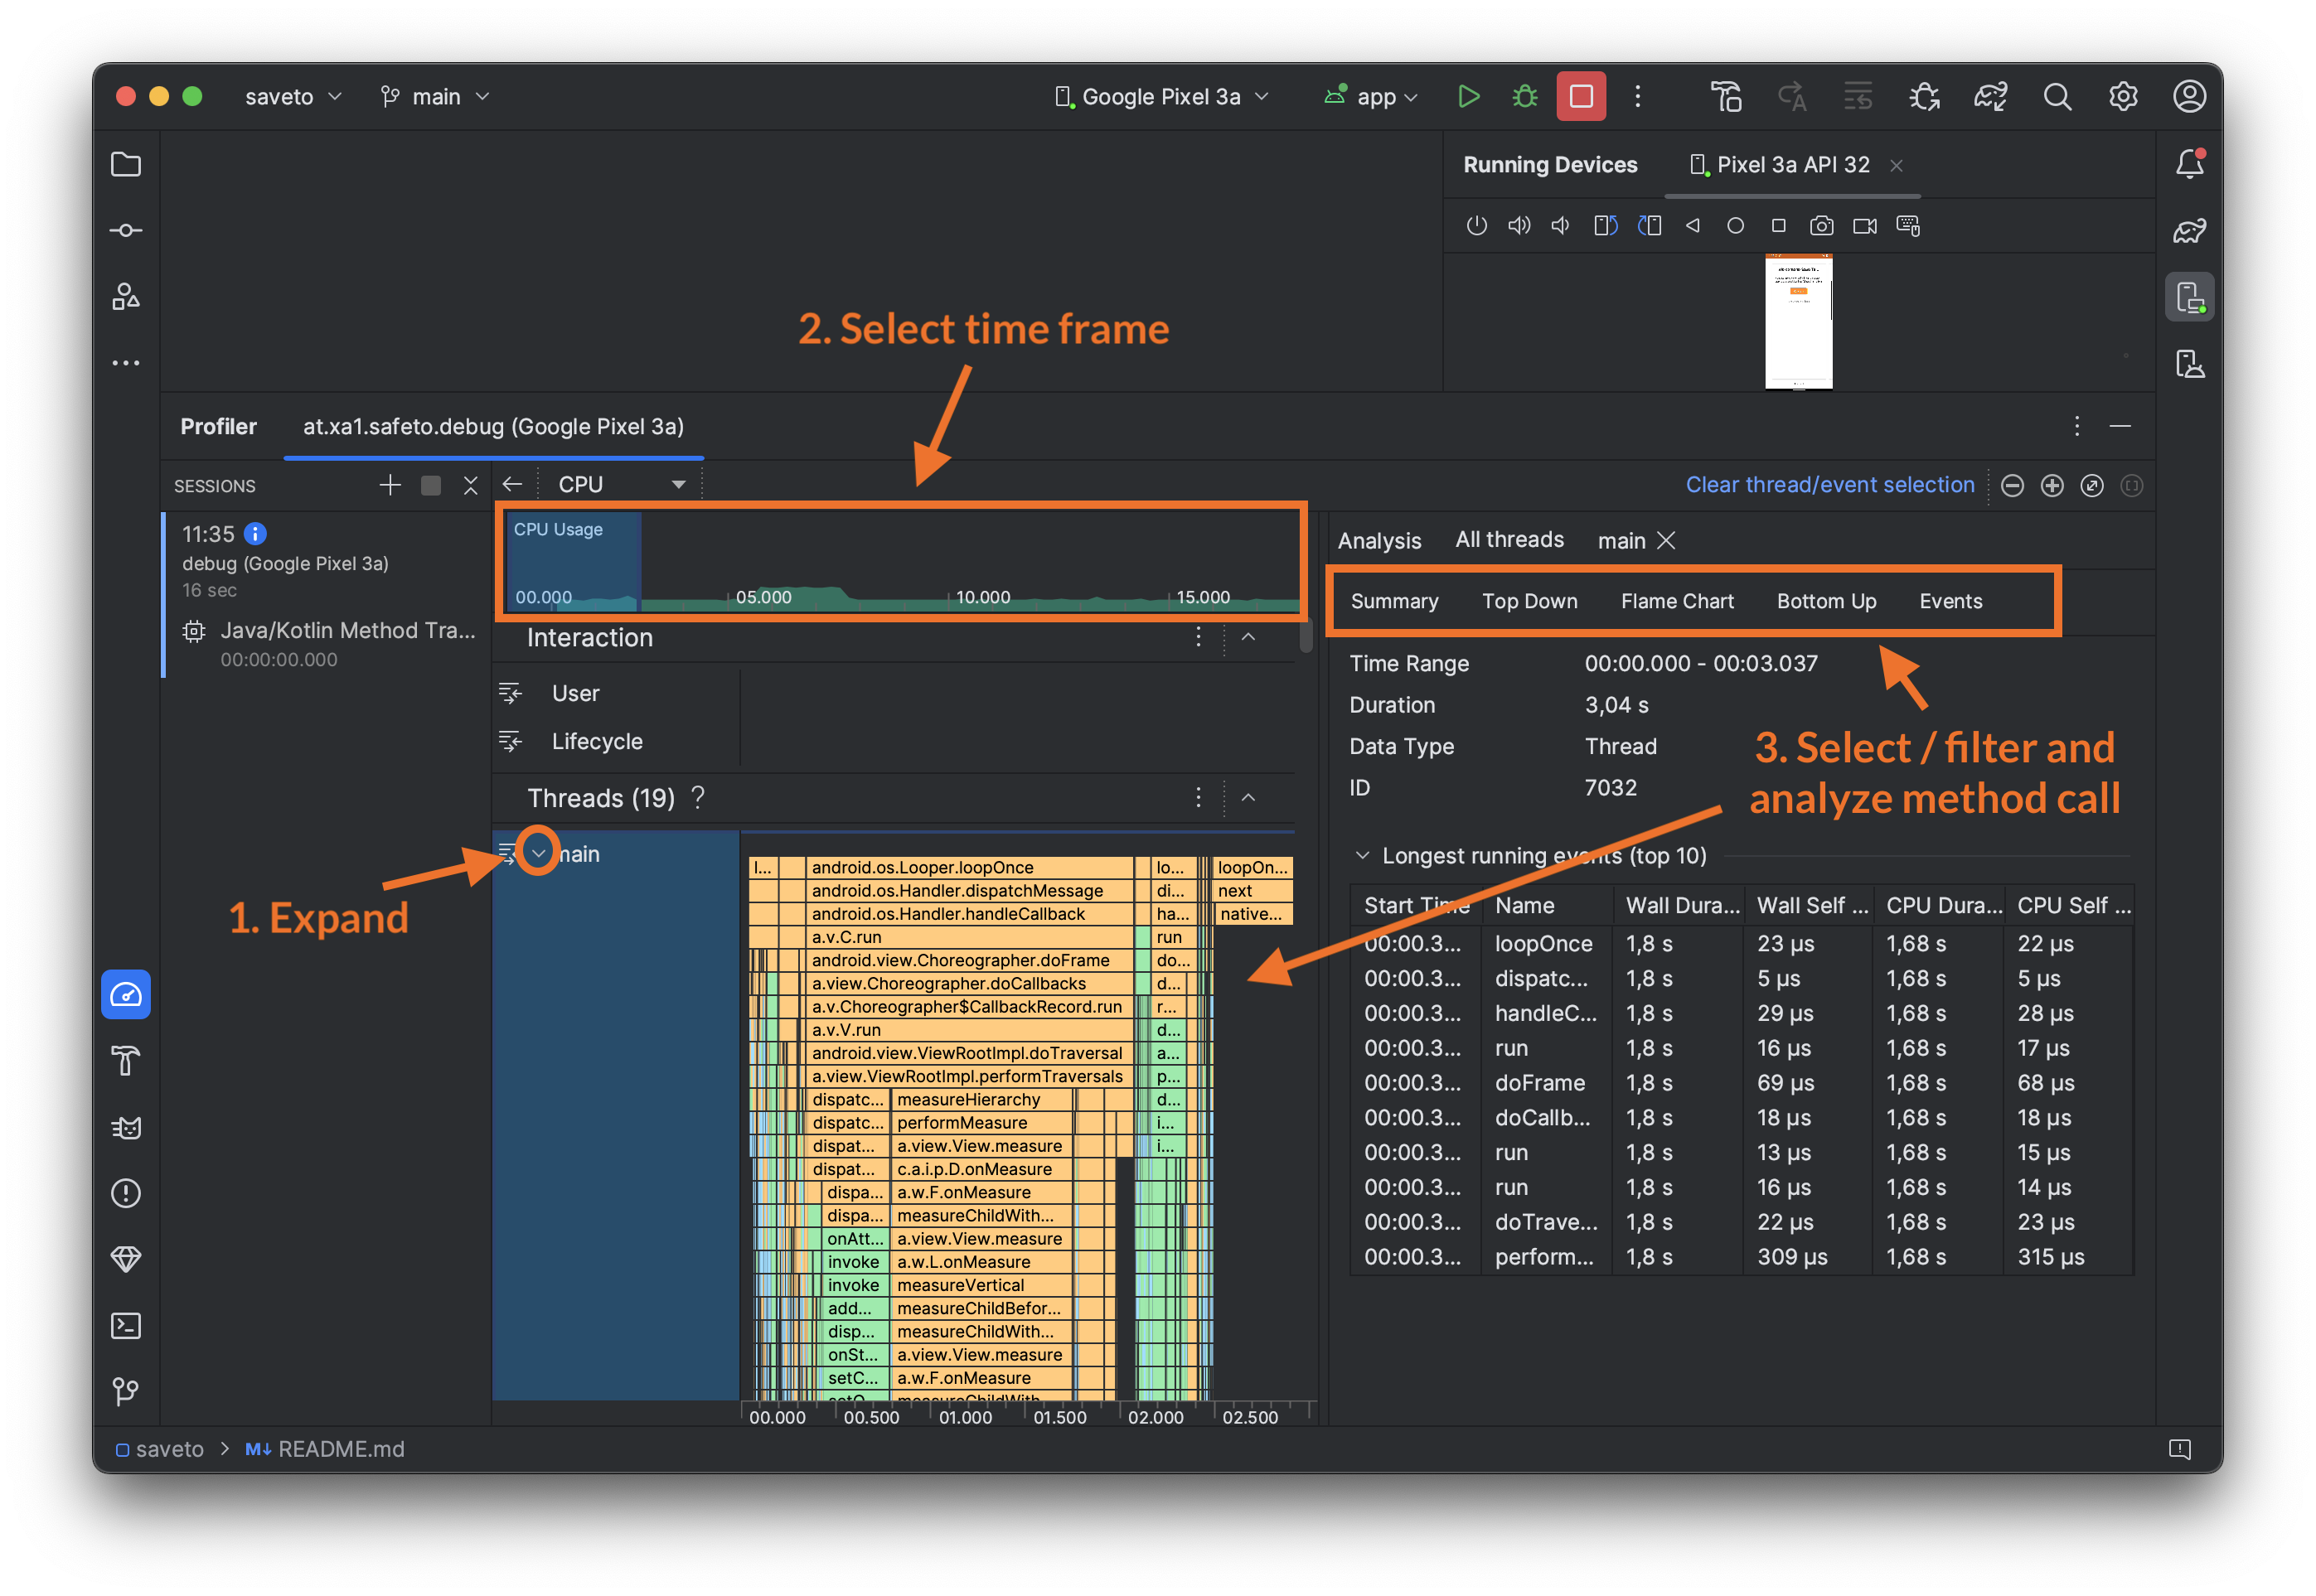
6 Analyze Data
Make sure to expand the thread information by clicking on the little arrow. Now you see a flame chart of the call stack over time. Select a desired time frame by clicking and dragging in the timeline. You can find long lasting method calls in the flame chart and click on them, and/or analyze via the different tabs in the “Analysis” section.
Conclusion
I hope this little step-by-step guide helped you to get the profiler up and running. Have fun improving your app startup time!